Spatial Data Infrastructure (SDI) for Gender Employment Trends in Austria
Development of Employment Figures by Gender In Autsria
Explore Austria’s gender employment trends through this interactive dashboard, powered by a robust Spatial Data Infrastructure (SDI). This platform integrates spatial and temporal data, uncovering employment disparities across regions and over time. Read on to learn how this SDI was designed.
Introduction
In today’s data-driven world, effective decision-making relies heavily on the ability to manage, analyze, and visualize complex datasets. A well-designed Spatial Data Infrastructure (SDI) enables this by integrating geospatial data across multiple sources, fostering collaboration, and supporting informed decisions.
This project focuses on developing an SDI tailored to Austria’s gender employment figures over a period of time. By leveraging open-source tools and technologies, the project highlights how SDIs can be applied to address pressing societal challenges, such as gender disparities in employment, while delivering actionable insights through interactive dashboards
Objective
The project’s primary objective was to design a comprehensive SDI that could:
- Collect and integrate employment data from multiple sources, including Statistik Austria and Eurostat.
Develop web services to share geospatial data and visualizations with diverse stakeholders.
Enable spatial analysis to identify employment trends and disparities across Austria’s urban and rural regions.
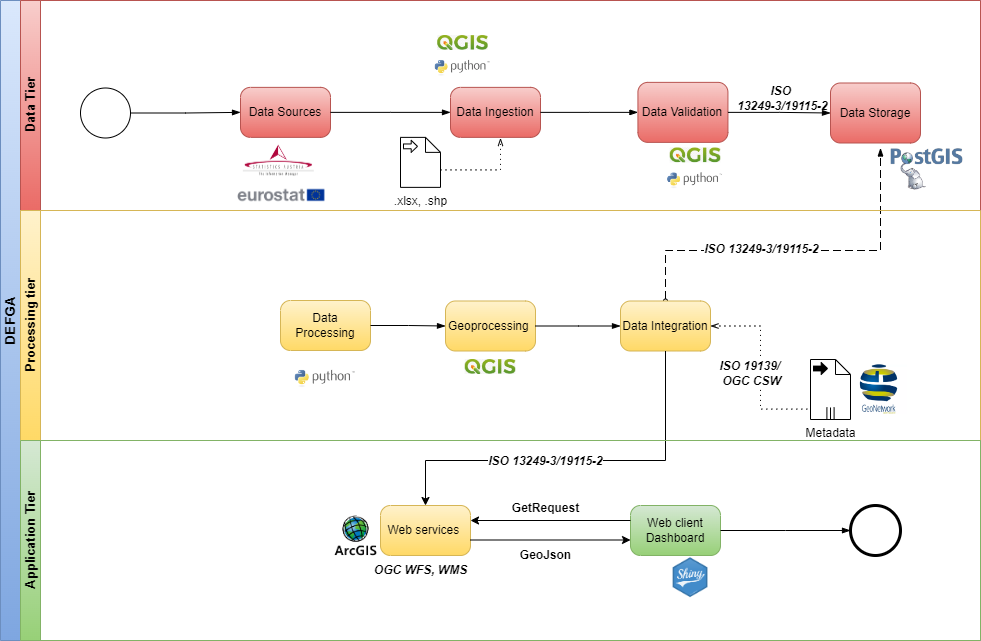
SDI Architecture
The architecture of this SDI was designed with flexibility, accessibility, and functionality in mind, leveraging open-source tools to ensure scalability and sustainability.
- Data Integration
- Employment data from Statistik Austria and administrative datasets from Eurostat were standardized and stored in a PostGIS-enabled PostgreSQL database.
- Data , code and project management documents can be found here: Gitlab
- Open Geoservices
The project prioritized interoperability by publishing OGC-compliant web services through GeoServer and ArcGIS Server.
WMS (Web Map Services) were used to provide real-time access to geospatial data.
Metadata was managed and published using GeoNetwork, ensuring discoverability and standardization.
- Visualization Tools
The interactive dashboard was developed using Shiny apps an R-based framework for building data apps.
It integrates spatial and temporal datasets, providing users with:
Customizable maps highlighting gender imbalances and urban-rural disparities.
Interactive charts and filters to explore trends by gender, region, and year.
- Scalable Architecture
- By using open-source software, the SDI ensures adaptability for future applications, making it a sustainable solution for ongoing spatial data challenges.
Results
The interactive dashboard serves as the tangible outcome of this SDI project, showcasing its capabilities in visualizing and analyzing gender employment trends across Austria over a 10-year period.
Users can explore gender-specific disparities in employment across regions.
The dashboard provides dynamic visualizations that highlight temporal trends and urban-rural contrasts.
Experience the Dashboard
- Explore the dashboard in action: Click to dashboard